
Solana (SOL) remains one of the most closely watched altcoins as traders assess whether the next major move will be a breakout rally or another period of consolidation. After a strong multi-month recovery, price action is now compressing near key technical levels — a phase that often precedes high volatility.
The market structure shows mixed signals: improving on-chain activity and institutional interest support the bullish case, while macro uncertainty and resistance pressure keep bears in the game.
Current Market Structure#
Solana has recently entered a consolidation range, typically a sign of indecision before expansion. Short-term charts show tightening volatility bands and declining volume, which historically precede large directional moves.
Recent analysis indicates SOL has been consolidating for several weeks, with volatility building beneath the surface. According to market data, a decisive break above the upper range could trigger a rally, while failure to hold support may accelerate downside pressure.
Technically, the trend remains neutral-to-bullish on higher timeframes but fragile on the weekly chart.
Key Support and Resistance Levels#
From a pure technical perspective, these zones are critical for traders:
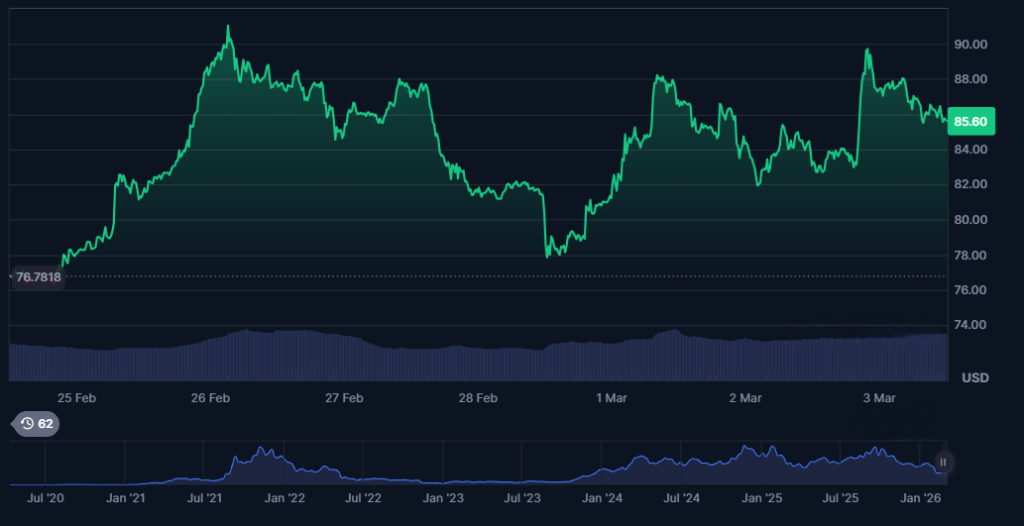
Major Resistance Zone: $88–$92
Mid Resistance: $84
Immediate Support: $77
Breakdown Risk Level: $70
If bulls push price above the major resistance band with strong volume, the next leg higher could unfold quickly. However, repeated rejection near resistance would confirm distribution.
Price behavior around the $77 support is particularly important — this level currently defines the short-term trend bias.
Bullish Case: Reasons for Upside#
Several catalysts support a potential bullish continuation:
1. Growing Network Activity#
Rising wallet addresses and ecosystem usage suggest underlying demand. Increasing activity often precedes price expansion phases.
2. Institutional Momentum#
The planned launch of regulated Solana futures by CME Group signals growing institutional interest, which historically improves liquidity and market maturity.
3. Altcoin Cycle Dynamics#
During altcoin-led rallies, capital tends to rotate into high-beta chains like Solana. Previous market phases have shown SOL outperforming when risk appetite increases.
4. Technical Compression#
Volatility squeezes frequently resolve in the direction of the higher-timeframe trend — currently still upward since the broader recovery phase.
If these factors align, SOL could attempt a breakout toward the psychological $100 region in coming weeks.
Stay in the loop
Get crypto news before the market moves
Join thousands of investors who read our daily briefing.
No spam. Unsubscribe anytime.
Bearish Risks and Downside Triggers#
Despite the constructive backdrop, several warning signs remain.
Macro Sensitivity#
Crypto markets recently fell after geopolitical tensions triggered risk-off sentiment, with Solana among the assets that declined.
Range Rejection Risk#
Multiple failures near resistance often lead to sharp pullbacks as trapped longs exit positions.
Historical Reliability Concerns#
Solana has experienced network outages in the past, events that historically pressured the SOL price and damaged trader confidence.
Cross-Chain Capital Rotation#
Research shows capital can rotate between blockchains rather than lift all assets simultaneously, meaning Solana could underperform even during broader crypto strength.
A weekly close below $70 would likely shift momentum decisively bearish.
Momentum Indicators and Trend Signals#
Momentum oscillators currently show a cooling phase after the previous rally. RSI on the weekly timeframe is drifting toward neutral territory — not yet oversold but no longer strongly bullish.
Moving averages are still positively aligned on higher timeframes, but the gap is narrowing. This often marks a transition period rather than a confirmed trend reversal.
Volume profile analysis suggests heavy trading interest near the current range, reinforcing the idea that a breakout — in either direction — could be explosive.
Outlook: Decision Zone Ahead#
Solana is approaching a classic technical inflection point. The structure is neither fully bullish nor bearish — instead, it reflects a market preparing for its next major move.
Bullish scenario:#
- Break and hold above $92
- Expanding volume
- Continued ecosystem growth
Bearish scenario:#
- Loss of $77 support
- Macro risk-off environment
- Weak altcoin sentiment
Until one of these triggers confirms, traders should expect choppy, range-bound behavior with sudden volatility spikes.
Bottom Line#
Solana’s technical outlook sits at a crossroads. The broader trend still leans constructive, supported by network growth and institutional developments. However, resistance pressure and macro uncertainty keep downside risks firmly in play.
The next few weekly closes will likely determine whether SOL is preparing for a bullish expansion phase — or setting up for a deeper corrective move.