
There is something quietly compelling happening with Cardano right now, and most of the market is too distracted by Bitcoin’s headlines to notice it. ADA entered this week near $0.2759, spent six straight days bleeding lower in a controlled, low-volume decline, and landed at $0.251 by May 18 — a drop of roughly 9% across the week. On the surface, that looks bearish. Look closer, and a very different story begins to emerge. The selling is thinning. The support is holding. And beneath the sluggish price action, a stack of fundamental catalysts is quietly assembling that could make this week’s low the most important price level Cardano trades at all year.
Weekly Chart Reading: Six Days of Controlled Decline
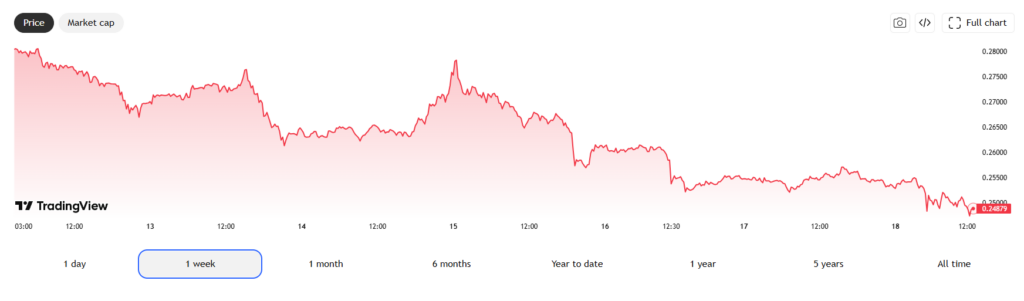
Referencing the May 12–18 hourly chart directly, the pattern is unmistakable. ADA opened the week at $0.2759 — itself a meaningful level that had acted as a support base in early May — and then sold off steadily through every session without a single convincing bounce attempt. The volume throughout this decline remained notably thin, a technically critical observation. Sellers were not rushing for the exits with conviction. This was passive drift, not panic distribution.
By May 18, ADA found itself at $0.251 — sitting directly on top of what multiple technical frameworks identify as the most critical demand zone in its entire current structure.
Sellers are no longer driving aggressive breakdowns, and price continues to stabilize above the $0.25–$0.26 support zone, signaling steady demand absorption — while the repeated defense of lower levels and improving higher-low formations suggest that the market is preparing for a directional move.
That $0.25 level is not arbitrary. It is the line in the sand between a controlled consolidation and a genuine breakdown scenario. Every serious ADA trader has it marked on their chart this week.

Technical Indicators: Bearish Bias With a Reversal Signal Forming
The indicator picture is nuanced — bearish on the surface, but with a potentially significant reversal signal emerging beneath.
Across 23 technical indicators, Cardano shows a bearish short-term bias — 13 signals point lower, 2 higher, 8 neutral, with oscillators at 1 buy and 2 sell, and moving averages at 1 buy and 11 sell — consistent with the 7.2% decline over the past seven days, with ADA currently trading at the support level of $0.2543 and the RSI(14) at 46.41, balanced — momentum neither stretched nor compressed at current levels.
That RSI reading deserves closer attention. At 46.41, ADA is approaching oversold territory without having reached it yet — meaning there is room for one more leg lower before a technically compelling bounce becomes statistically inevitable. But here is the development that stopped technical analysts in their tracks this week.
Crypto analyst Ali Martinez reported that Cardano’s SuperTrend indicator on the daily chart flipped to a buy signal on May 14, 2026. This followed a sell signal on September 25, 2025 that preceded a 73% price decline. Martinez identified $0.33 as the first key resistance and $0.25 as crucial support to maintain the bullish thesis.
A SuperTrend buy signal after a 73% decline, landing directly on the $0.25 support floor — that is not a coincidence. That is a technically meaningful convergence that demands serious attention.
Bullish Catalysts: The Fundamental Case Is Strengthening
Despite the weekly price weakness, the news flow around Cardano this week has been overwhelmingly positive — a divergence between price and fundamentals that historically precedes meaningful reversals.
CME Nasdaq Crypto Index Inclusion: CME Group, in partnership with Nasdaq, will launch its first market-cap weighted cryptocurrency index futures on June 8, 2026. The Nasdaq CME Crypto Index includes seven assets, with Cardano representing 0.65% of the initial weight — offering institutional investors regulated, cash-settled exposure alongside Bitcoin and Ethereum through a single instrument. Inclusion in a traditional finance regulated product alongside BTC and ETH is a validation that carries significant weight for institutional capital allocation.
Van Rossem Hard Fork Approaching: Cardano released Node v11.0.1 in May 2026 — a mandatory upgrade preparing the network for the imminent Van Rossem hard fork and Protocol Version 11. Hard fork catalysts have historically driven ADA price action with considerable force. The last major upgrade cycle pushed ADA from multi-month lows to new highs within weeks of deployment.
Scorechain Compliance Integration: The Cardano Foundation fully integrated the network with Scorechain’s compliance platform, providing risk scoring, entity attribution, and transaction monitoring specifically designed for Cardano’s UTXO model — allowing institutions to oversee ADA and native tokens within existing compliance workflows. Regulated institutions cannot touch assets without compliance infrastructure. This integration removes one of the last remaining barriers to institutional ADA adoption.
Record Developer Activity: Activity reports from late March 2026 show that on a single day, 878 commits were pushed across 67 repositories, with the cardano-node and mithril projects seeing the most changes — indicating multiple teams are actively working on core protocol improvements, scaling solutions, and supporting tools.
Bearish Risks: The Bears Still Have Arguments
Honest analysis requires acknowledging the bear case. And for ADA right now, it is real.
According to Elliott Wave analysis, the ADAUSD pair is expected to decrease in sub-wave 5, the final part of the bearish impulse wave — and if the price drops below $0.24, bearish momentum may strengthen considerably.
Based on multiple technical quantitative indicators, the current forecast for Cardano in 2026 is bearish, with only 3 indicators signaling bullish signals and 29 signaling bearish signals as of May 16, 2026.
Bitcoin dominance at elevated levels also continues to act as a structural headwind. When BTC dominance stays high, altcoin capital rotation stalls — and ADA, as a large-cap altcoin with a massive circulating supply of 36.97 billion tokens, is particularly sensitive to this dynamic.
Key Levels: The Numbers Every ADA Trader Must Know
| Level | Role | Signal |
|---|---|---|
| $0.33 | Primary Resistance Target | 🔴 SuperTrend Analyst Target |
| $0.2788 | Critical Breakout Trigger | 🔴 Van Rossem Catalyst Level |
| $0.2759 | Weekly Open / Resistance | 🔴 Immediate Overhead |
| $0.2543 | Current Support Floor | 🟡 Must Hold Zone |
| $0.2514 | Secondary Support | ✅ Next Demand Level |
| $0.2483 | Key Demand Zone | ✅ Strong Buy Area |
| $0.24 | Bear Scenario Trigger | 🔴 Breakdown Warning |
| $0.22 | Historical Base Support | 🔴 Worst Case Floor |
Conclusion
Heading into May 2026, if momentum improves and resistance breaks, ADA could move toward $0.32–$0.35, signaling early recovery. However, if price remains below resistance, ADA is likely to continue trading sideways within a $0.23–$0.30 range before a clearer directional move emerges.
The June 8 CME Nasdaq index futures launch is now the single most important near-term date on every ADA trader’s calendar. Institutional products of this nature consistently attract passive capital flows in the weeks surrounding their launch — and with ADA sitting at a historically compressed valuation near multi-year support, the timing of that catalyst could not be more consequential.
Overall, Cardano is no longer in a declining phase — it is positioned just below a critical resistance zone where both structure and underlying momentum are beginning to align, and how it reacts here will ultimately define its 2026 trajectory.
The $0.25 floor is holding. The SuperTrend has flipped. The Van Rossem upgrade is loading. And institutional access is arriving on June 8. Cardano’s weekly chart may look red — but the story underneath it is building toward something much more significant.